This dashboard contains visualizations of the traffic stop outcomes for each tested racial group (Black people and White, non-Hispanic people). This dashboard shows the outcome trends over time. To show this, the data was broken into seven periods of six months each (except for period seven, which only includes the final three months of publicly available data).
Only agencies that qualified for at least one statistically valid test are included in the dashboard. To qualify for a test, the department must have reported at least 50 stops and 5 outcomes (arrest, person search, vehicle search, etc.) for the observed test for each racial group. Departments that qualified for some but not all tests are included with blank sections for each test that did not qualify for inclusion.
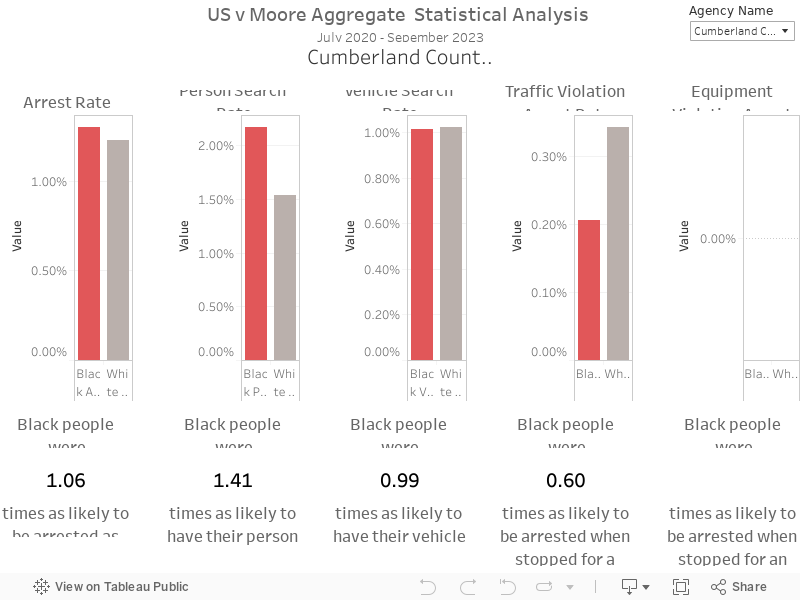
This dashboard contains visualizations of the traffic stop outcomes for each tested racial group (Black people and White, non-Hispanic people). This dashboard shows the outcome trends over time. To show this, the data was broken into seven periods of six months each (except for period seven, which only includes the final three months of publicly available data).
Only agencies that qualified for a majority of tests across the seven time periods are included in the dashboard. To qualify for a test, the department must have reported at least 50 stops and 5 outcomes (arrest, person search, vehicle search) for the observed test for each racial group during the time period. Departments that qualified for some but not all tests are included with blank sections for each test that did not qualify for inclusion.
